How to Read a Mutual Fund Factsheet : Key Numbers That Actually Matter
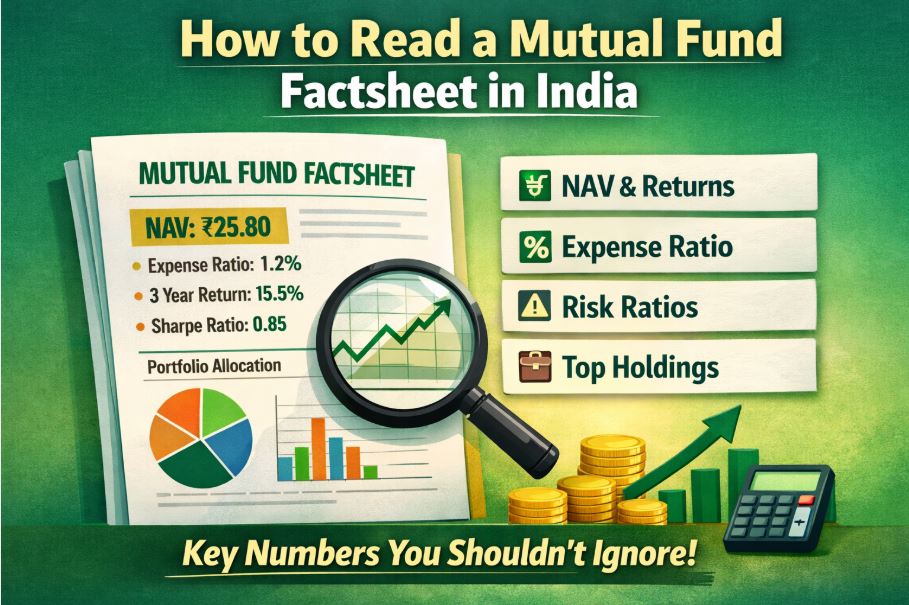
Most investors glance at past returns and move on. That’s a mistake. The factsheet holds a treasure trove of signals — if you know where to look. Here’s the complete, no-fluff guide for Indian investors.
1. What Is a Mutual Fund Factsheet?
A mutual fund factsheet — also called a fund information document or monthly data card — is a standardised, one-to-two-page snapshot that every AMC (Asset Management Company) in India must publish every month under SEBI regulations. Think of it as a fund’s report card: it discloses performance, portfolio composition, risk metrics, costs, and manager details in a single place.
AMFI (Association of Mutual Funds in India) mandates the minimum disclosures. In practice, large AMCs like SBI, HDFC, Mirae, Axis, and Nippon publish rich factsheets that go well beyond the minimum — and that’s where the real insight lives.
2. NAV — The Number Everyone Misreads
The Net Asset Value (NAV) is the per-unit price of the fund on a given day. It is calculated as:
Formula–
NAV = (Total Assets − Total Liabilities) ÷ Total Number of Units Outstanding
Here is the critical mistake most new investors make: a low NAV does not mean a cheap fund. A fund with NAV ₹15 is not “cheaper” or “better value” than one with NAV ₹850. NAV only tells you the current price per unit — your returns depend entirely on how the NAV changes over time, not its absolute level.
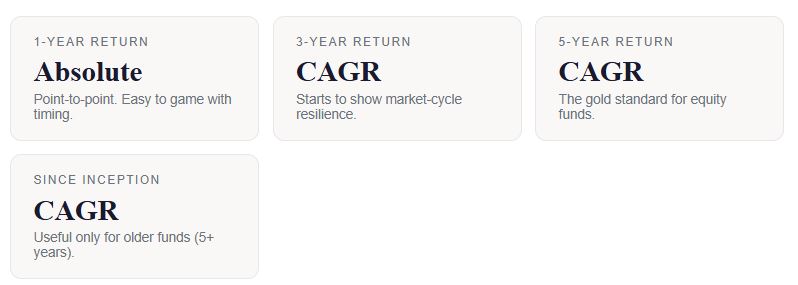
3. Returns: 1Y, 3Y, 5Y & CAGR Explained
Factsheets always display returns across multiple time horizons. Here’s how to interpret them without being misled by marketing.
The benchmark comparison is non-negotiable
SEBI mandates that AMCs compare fund returns against the Total Return Index (TRI) benchmark — not the plain price index. TRI includes dividends reinvested, making it a fairer hurdle. If a fund consistently underperforms its TRI benchmark over 5 years, there is very little reason to pay active management fees. Consider a comparable index fund or ETF instead.
Rolling Returns — The Smarter Metric :
Point-to-point returns can be misleading based on start/end dates. Rolling returns (e.g., all 3-year periods over 5 years) give a more honest picture of consistency. Tools like ValueResearch Online or Morningstar India show rolling return charts — check them before investing.
Understanding XIRR for SIP investors
If you invest via SIP, point-to-point NAV returns don’t apply to you. Use XIRR (Extended Internal Rate of Return) to measure your personal SIP return, as it accounts for different investment dates and amounts. Most AMC portals and apps calculate this automatically.
“A fund that beat the benchmark last year is interesting.
A fund that beat it consistently for 7 years is worth your money.”
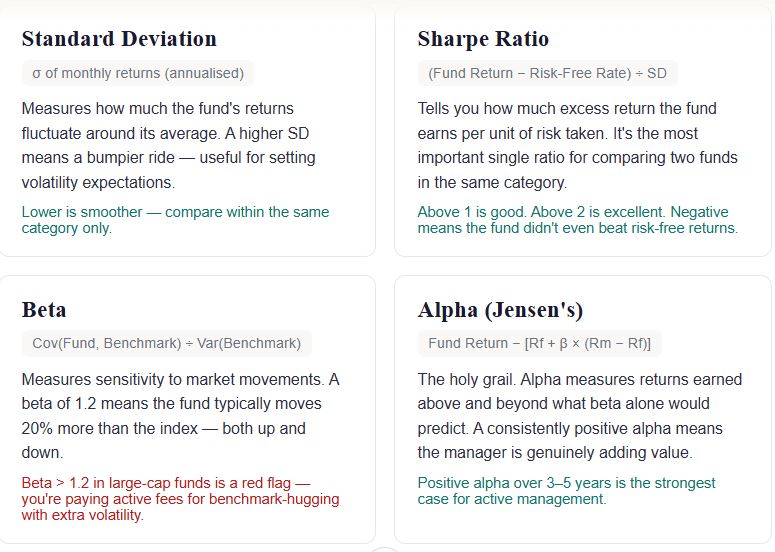
4. Risk Ratios That Actually Protect You
This is where most retail investors stop reading — which is exactly why they end up surprised when markets correct. These four ratios are your early warning system.
The Risk-o-meter: simple but mandatory
SEBI’s revised Risk-o-meter (effective January 2021) classifies funds on a 6-point scale: Low, Low-to-Moderate, Moderate, Moderately High, High, and Very High. Critically, AMCs must now review and update the risk-o-meter monthly. If a debt fund’s risk rating has quietly moved from Moderate to High, that’s a signal to re-evaluate.
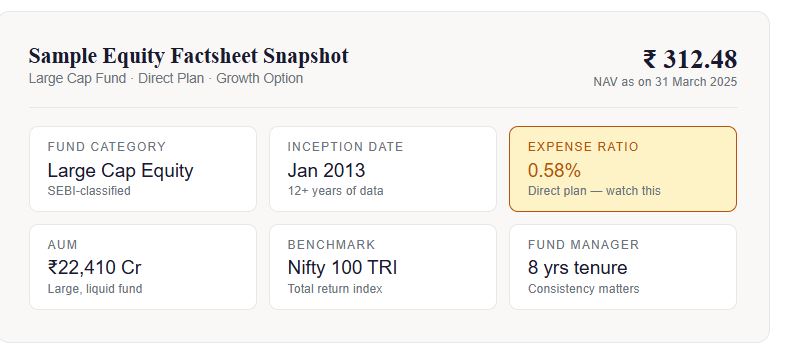
5. Expense Ratio & Exit Load
The expense ratio is the annual fee deducted from the fund’s assets to cover management, administration, and distribution costs. It is expressed as a percentage and is deducted daily from NAV — you never see it as a separate charge, which is why it’s easy to ignore. Don’t ignore it.
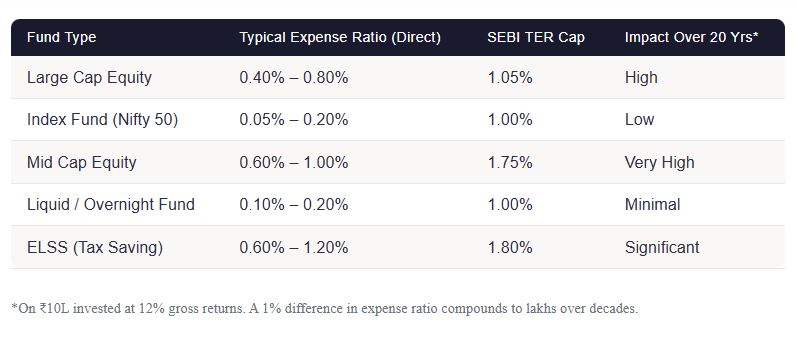
Always choose Direct Plan
Direct plans have no distributor commission built in — this gives them a 0.5% to 1.5% lower expense ratio than Regular plans of the same fund. Over 15–20 years, that difference can account for 15–25% more corpus. There is almost never a reason to invest in a Regular plan if you can invest directly through the AMC’s website or platforms like MFCentral.
Exit Load
Exit load is a fee charged when you redeem units before a certain holding period. Most equity funds charge 1% if redeemed within 1 year. Liquid funds and overnight funds typically have no exit load. Always check the factsheet’s “exit load” section before you plan a redemption — especially for mid/small cap funds, which sometimes have 2-year exit load windows.
6. Portfolio Holdings & Concentration Risk
Every factsheet discloses the top 10 holdings and their percentage weight. This section tells you what you’re actually buying — and whether the fund is as “diversified” as it claims to be.
Key things to check in the portfolio section
- Top 10 concentration: If the top 10 stocks account for >60% of assets, you have a concentrated fund. That’s fine for a deliberate conviction portfolio — but not for a “diversified large cap” fund.
- Sector allocation: Overexposure to a single sector (e.g., financials at 40%+) creates sector-specific risk. Cross-check against the benchmark’s sector weights.
- Market cap mix: A “large cap” fund should have 80%+ in large caps per SEBI rules. If you find significant mid-cap exposure, the fund may be taking on more risk than its category suggests.
- Portfolio churn: High portfolio turnover (visible in the annual report, not always the factsheet) means higher transaction costs and tax drag. A turnover ratio above 100% for an equity fund warrants scrutiny.
- Cash & equivalents: A fund holding 8–15% in cash is taking a defensive stance — it may lag during bull runs but protects during downturns. Extreme cash levels (>20%) can signal manager uncertainty.
- Debt fund credit quality: For debt funds, check the credit rating breakdown — AAA/A1+ rated securities are safest. Any significant allocation to AA or below carries credit risk that the risk-o-meter alone won’t capture.
7. AUM — Does Size Matter?
Assets Under Management is the total market value of money the fund manages. In India, the mutual fund industry manages over ₹60 lakh crore in AUM (as of early 2025). Here’s when AUM matters for your decision:
When AUM is too small
A fund with AUM below ₹100 crore may face liquidity issues, may not be able to buy or sell large positions without impacting prices, and has higher risk of being merged or wound up by the AMC. For new investors, prefer funds with AUM above ₹500 crore.
When AUM is too large (for small/mid caps)
Small and mid cap funds with AUM above ₹25,000–30,000 crore face a genuine performance problem — the fund becomes so large it struggles to take meaningful positions in smaller stocks without moving the price. This is called the “capacity constraint.” Several top mid cap funds have soft-closed to lump-sum investments for this reason.
8. The 10-Point Factsheet Checklist
Before investing in any mutual fund, run through this checklist using the latest factsheet:
- Is it a Direct Plan? (Not Regular)
- Has the fund beaten its TRI benchmark over 5 years?
- Is the expense ratio below category average?
- Is the Sharpe ratio above 1 over 3 years?
- Has the fund manager been consistent for 3+ years?
- Is the AUM appropriate for the fund category?
- Is the Risk-o-meter rating aligned with your risk profile?
- Is sector concentration below 35% for any single sector?
- For debt funds: is credit quality predominantly AAA?
- Does the fund have reasonable exit load terms for your holding period?
Next time before investing, spend 5 minutes on the factsheet—it can save you years of regret.”