NAV(Net Asset Value)- A real indicator in mutual funds
If you’ve ever looked at investing in mutual funds, you’ve probably come across the term “NAV.” But what exactly does it mean, and why should you care? Let’s break it down in simple terms.
What is NAV in Mutual Funds?
NAV stands for Net Asset Value. Think of it as the per-unit price of a mutual fund—essentially, it’s what one unit of your mutual fund is worth at any given time.
Imagine you and nine friends pool money to buy a pizza business. If the entire business is worth ₹10,000 and you’ve divided ownership into 100 equal shares, each share would be worth ₹100. That’s basically what NAV represents for mutual funds.
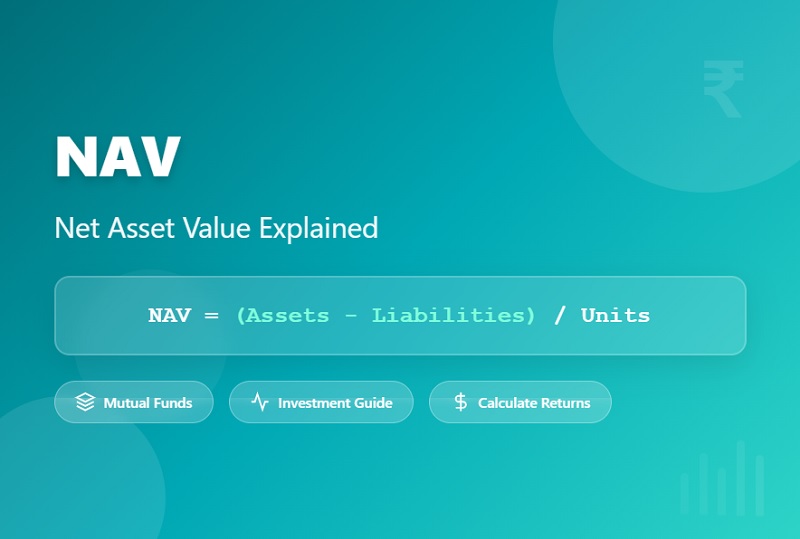
How is NAV Calculated? The Simple Formula
The NAV calculation follows a straightforward formula:
NAV = (Total Assets – Total Liabilities) / Total Number of Outstanding Units
Let’s break this down:
- Total Assets: All investments the fund holds (stocks, bonds, cash, etc.) plus any income earned
- Total Liabilities: Any expenses, fees, or pending payments the fund owes
- Outstanding Units: The total number of fund units investors currently hold
Real-World NAV Calculation Example
Let’s say ABC Mutual Fund has:
- Total investments worth: ₹50,00,00,000
- Cash in hand: ₹50,00,000
- Dividend receivable: ₹25,00,000
- Management fees payable: ₹15,00,000
- Other expenses: ₹10,00,000
- Total outstanding units: 10,00,000
Calculation:
- Total Assets = ₹50,00,00,000 + ₹50,00,000 + ₹25,00,000 = ₹50,75,00,000
- Total Liabilities = ₹15,00,000 + ₹10,00,000 = ₹25,00,000
- Net Assets = ₹50,75,00,000 – ₹25,00,000 = ₹50,50,00,000
- NAV = ₹50,50,00,000 ÷ 10,00,000 = ₹505 per unit
When is NAV Calculated?
In India, SEBI (Securities and Exchange Board of India) mandates that mutual funds must calculate and publish their NAV:
- Every business day for open-ended mutual funds
- At least once a week for close-ended funds
- The NAV is typically published by 9:00 PM each day
- It reflects the closing prices of securities as of that trading day
NAV vs Share Price: What’s the Difference?
Many new investors confuse NAV with stock prices. Here’s how they differ:
| Feature | Mutual Fund NAV | Stock Price |
|---|---|---|
| Pricing Frequency | Once per day (end of day) | Changes every second during trading hours |
| Price Discovery | Calculated based on underlying assets | Determined by supply and demand |
| Trading Time | Orders processed at day-end NAV | Real-time buying and selling |
| Volatility | Less volatile within a day | Can be highly volatile intraday |
| Best for | Long-term investors | Active traders and long-term investors |
Does a Lower NAV Mean a Better Investment?
This is one of the biggest myths in mutual fund investing. A lower NAV does NOT mean the fund is cheaper or a better buy.
Here’s why:
Example:
- Fund A: NAV = ₹50, returns 12% annually
- Fund B: NAV = ₹500, returns 12% annually
If you invest ₹10,000 in each:
- Fund A: You get 200 units, after 1 year = 200 × ₹56 = ₹11,200
- Fund B: You get 20 units, after 1 year = 20 × ₹560 = ₹11,200
Your returns are identical! What matters is the percentage return, not the NAV itself.
Growth vs Dividend Plans: NAV Comparison
| Aspect | Growth Plan | Dividend Plan |
|---|---|---|
| NAV Behavior | Continuously increases | Drops when dividend paid |
| Income Distribution | No dividends paid out | Periodic dividend payments |
| Reinvestment | Automatic (no action needed) | Must be manually reinvested |
| Tax Efficiency | More tax-efficient for long-term | Dividends are taxable |
| Ideal For | Wealth accumulation | Regular income seekers |
| NAV Example | Starts ₹10, grows to ₹50 | Starts ₹10, grows to ₹30, pays ₹2 dividend, drops to ₹28 |
Types of Mutual Funds and Their NAV Characteristics
| Fund Type | NAV Volatility | Typical NAV Movement | Risk Level |
|---|---|---|---|
| Equity Funds | High | Can fluctuate significantly daily | High |
| Debt Funds | Low to Moderate | Relatively stable with gradual changes | Low to Moderate |
| Hybrid Funds | Moderate | Balanced fluctuations | Moderate |
| Liquid Funds | Very Low | Minimal daily changes | Very Low |
| Index Funds | Follows Index | Mirrors benchmark index | Moderate to High |
How to Use NAV for Smart Investment Decisions
1. Track Performance, Not Just NAV
Compare the fund’s returns over 3-5 years rather than just looking at current NAV.
2. Use NAV for SIP Calculations
Your Systematic Investment Plan (SIP) buys more units when NAV is low and fewer when it’s high—this is rupee cost averaging working for you.
3. Check Historical NAV Trends
Look at how NAV has moved during market crashes and recoveries to understand fund resilience.
4. Compare Similar Funds
Use NAV trends along with expense ratios and fund manager performance to make informed choices.
NAV and Your Investment Returns
Let’s see how NAV affects your actual returns:
Scenario: You invest ₹1,00,000 via SIP over 12 months
| Month | NAV | Amount Invested | Units Purchased |
|---|---|---|---|
| Jan | ₹100 | ₹8,333 | 83.33 |
| Feb | ₹95 | ₹8,333 | 87.72 |
| Mar | ₹90 | ₹8,333 | 92.59 |
| Apr | ₹85 | ₹8,333 | 98.04 |
| May | ₹90 | ₹8,333 | 92.59 |
| Jun | ₹95 | ₹8,333 | 87.72 |
| Jul | ₹100 | ₹8,333 | 83.33 |
| Aug | ₹105 | ₹8,333 | 79.36 |
| Sep | ₹110 | ₹8,333 | 75.75 |
| Oct | ₹105 | ₹8,333 | 79.36 |
| Nov | ₹110 | ₹8,333 | 75.75 |
| Dec | ₹115 | ₹8,333 | 72.46 |
Total Units: 1,008
If the final NAV is ₹115, your investment value = 1,008 × ₹115 = ₹1,15,920
Return: 15.92% despite market volatility!
Common NAV Mistakes to Avoid
Mistake 1: Buying Only Low NAV Funds
A ₹10 NAV fund isn’t necessarily better than a ₹1,000 NAV fund. Focus on performance history instead.
Mistake 2: Panic Selling When NAV Drops
NAV fluctuations are normal. Unless there’s a fundamental issue with the fund, short-term drops shouldn’t trigger panic.
Mistake 3: Ignoring Expense Ratio
A fund with low NAV but high expense ratio (2%+) will eat into your returns more than a high NAV fund with low expenses (0.5%).
Mistake 4: Not Considering Fund Age
Older funds naturally have higher NAVs due to compounding. This doesn’t make them expensive.
FAQs About NAV
Q: What happens to NAV when I invest in a mutual fund? When you invest, new units are created at the current NAV. Your investment doesn’t change the NAV itself.
Q: Can NAV be negative? No, NAV cannot be negative. In the worst case, it approaches zero if the fund loses all its value.
Q: Why does NAV drop on dividend payout? When dividends are distributed, that cash leaves the fund, reducing total assets and therefore NAV.
Q: Is a growing NAV always good? Generally yes, but compare it with benchmark index and similar funds. A growing NAV in a falling market might indicate poor performance.
Q: Should I invest when NAV is low during market crashes? If the fund’s fundamentals are strong, low NAV during crashes can be an opportunity, but ensure you’re investing for the long term.
The Bottom Line
NAV is an important metric, but it’s just one piece of the puzzle. Think of it as the speedometer in your car—useful to know, but you also need to check the fuel efficiency, maintenance record, and safety features before making a decision.
When choosing mutual funds, look beyond NAV at factors like:
- Consistent performance over 5-10 years
- Fund manager’s track record
- Expense ratio and exit loads
- Investment philosophy and risk profile
- Portfolio composition and diversification
Remember, investing is a marathon, not a sprint. Focus on your financial goals, maintain discipline with SIPs, and let compound interest work its magic—regardless of whether the NAV is ₹10 or ₹1,000.